Archive for the ‘Projects’ Category

h1

Analysis of Soviet smoke detector plutonium

February 7, 2017

Plutonium is a practical and versatile substance, having applications that range from planetary extinction to routine fire protection, depending on the user’s fancy.  The element has been mass-produced in nuclear reactors since World War Two, and occurs in various isotopic compositions in the discharged reactor fuel, reflecting variables such as fuel burnup, initial uranium enrichment, and neutron spectral characteristics of the reactor design.  The Soviet Union cooked up more plutonium than any other nation.  Most of this was slated for the noble purpose of containing capitalist imperialism, but some found its way into commercial ionization smoke detectors like the KI-1, RID-1, and RID-6M.  (The bourgeois warmongers themselves preferred, and still prefer, americium-241 for this application.) Occasionally, people in the former USSR try to peddle their old smoke detector plutonium on the nuclear black market, thinking that it may attract top dollar from terrorists with an appetite for nuclear warfare.  We’ll examine that possibility in more detail shortly.

Since I was curious about the technical characteristics of Soviet smoke detector plutonium, I picked up an old KI-1 smoke detector and sacked it for the source.  The source design bears much resemblance to the “lipstick” sense chamber sources in early Pyrotronics detectors made in the USA.  This one is brass and a bit wider than its Pyrotronics analogue.  An internal axial thread positions a cup-shaped alpha particle shield around a band containing the active deposit, thereby regulating the amount of ionization produced by the source in the chamber and controlling the sensitivity of the detector.  The sections below describe my analysis of the gamma and alpha radiations emitted by this source, and my conclusions about the plutonium’s age, activity, mode of production, and suitability for nuclear combat.

Plutonium isotopics by gamma spectrometry

High-resolution gamma spectroscopic measurements allow direct determination of the relative concentrations of Pu-238, Pu-239, Pu-240, and Pu-241 in a plutonium sample.  In such measurements, Pu-242 is customarily inferred from heuristic correlations to the other isotopes; it can be directly measured only with costly and destructive mass spectrometry.  Additionally, the ratio of daughter Am-241 to parent Pu-241 can be used to date plutonium.  The basic methodology is discussed in good detail in Sampson, T. E., Plutonium Isotopic Composition by Gamma-Ray Spectroscopy (1986).  I employed the multiple linear regression (MLR) formula of Sarkar, Shah, et al. (2014) to estimate Pu-242.

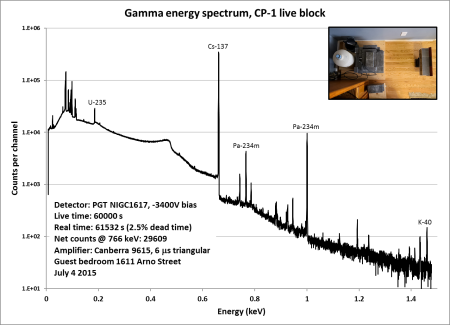
My gamma detector is a PGT n-type coaxial HPGe detector that lives in the guest bedroom of the home (the least radioactive room, as it should be), shielded with lead bricks and a graded inner shield of copper and tin sheet.  One preparation that is almost essential with plutonium is selective attenuation of the 59-keV gamma radiation from Am-241, as discussed in Sampson’s article above.  If you don’t do this, then the pileup and sum peaks caused by the intense Am-241 radiation will swamp the rest of the plutonium spectrum.  To hold the “lipstick” source, I made an attenuator out of rolled cadmium sheet and endcaps stuffed inside of a piece of copper water pipe with copper endcaps.  Such an arrangement works by strategically situating the K-edge energy of the absorber materials close to the energy of the offending radiation.  In quantitative gamma spec measurements, another important point is to avoid getting the source too close to the detector.  Otherwise, coincidences will distort the spectrum.  With the right attenuation and geometry, all that remains is to gather a statistically-useful number of counts in the spectrum–in this case, about 42 hours of counting.

The gamma spectrum is shown, annotated, in the gallery below.  It can be downloaded in ASCII format as an Excel spreadsheet here.  (Note that there are no channel numbers or energy calibration in the ASCII format, so you will have to add them.) As can be seen, Am-241 and Pu-239 peaks are scattered throughout, while Pu-238, Pu-240, and Pu-241 are represented by a single good peak each in the 150-keV neighborhood.  Am-241’s granddaughter Pa-233 is also in evidence, attesting to the unseen Np-237 daughter.  U-237 is a product of the minor alpha decay branch of Pu-241, and it interferes with some lines in the Am-241 decay spectrum as both nuclides decay to Np-237.  Those energies subject to interference cannot be used for quantitative analysis.   Click any image for the larger original:

Calculating relative activities from the peaks in the spectrum involves the following:

  • Measuring counts in each peak by peak-fitting algorithms.  I use the free software Hypermet-PC 5.12 to do this. Its algorithms are old, but well-known and still widely used.  Modern users will need to run it in DOSBox.
  • Correcting measured counts by an efficiency function of energy.  I fit this function in Hypermet-PC using a sealed Ra-226 source that can be placed in the same graded attenuator (and the same counting geometry) as the “lipstick” plutonium source.
  • Calculating relative activities from efficiency-corrected counts using the tabulated yields per decay of each radiation.  I used this website for my data.
  • Estimating Pu-242 activity using a suitable model.  My reference is here.

Once relative activities were established, I estimated total activities by comparing the gamma count rate on a Geiger counter between the KI-1 source and the ~60 microcurie Am-241 source from a Pyrotronics F-3/5A in the same counting geometry.  The overwhelming majority of the gamma rays emitted by both sources are 59-keV photons from Am-241.  These estimates are limited by the uncertainty surrounding the total activity of the Pyrotronics source.  The relative activities are known to much higher precision.  (I should note that the uncertainties given in the table relate to the relative measurements.)  As the table below illustrates, the KI-1 source contains a total activity of about 700 microcuries today, most of which is the 14-year weak beta emitter Pu-241.  The runner-up is 88-year alpha emitter Pu-238.  On an activity basis, the other nuclides are lower in the lineup.  The plutonium mass can be calculated, and it is about 1 mg.

The alpha spectrum

Alpha spectroscopy of plutonium is confounded by the fact that Pu-239 and Pu-240, and Pu-238 and Am-241, emit alpha particles with very similar energies.  The general technique is also laborious, involving chemical preparation of samples in virtually all cases.  Like Pyrotronics sources, there is some removable contamination on the KI-1 detector source.  I wiped a tissue on the source surface, ashed it, dissolved the residues in nitric acid, and evaporated them onto a stainless steel disc to make the spectrum shown below using an Ortec solid-state detector.  Despite this effort, it is not of great technical quality compared to what one could expect with a rigorous radiochemical technique.  All that said, though: the spectrum confirms the expectation of two main alpha energy groups, the larger at 5.4-5.5 MeV (Pu-238+Am-241) and the smaller at 5.1-5.2 MeV (Pu-239+Pu-240).

Dating plutonium using the Am-241:Pu-241 ratio

The Am-241:Pu-241 atom ratio is a daughter-parent ratio, a clock that allows us to date the plutonium.  More specifically, the method determines when Am was last chemically separated from the Pu, assuming that all the material in the source traveled together through the same process.  (The assumption may not be very good if multiple batches of Pu were mixed.)  A graphical solution of the coupled Bateman equations modeling Am and Pu ingrowth and decay is shown below.  The sample age is the point on the horizontal axis where the solution intersects the measured value of Am-241:Pu-241, represented by the one-standard-deviation band between the red and blue lines.  This plutonium appears to be 44.9 ± 0.4 years old, meaning it was probably processed in 1972.

Other dating ratios

Another member of the Pu-241 decay chain, Pa-233, can also be used for dating.  In its ratio with Am-241, we get an estimate of 55.4 years; in its ratio with Pu-241, we get an estimate of 48.2 years.  The Am-241:Pu-241 method above predicted 44.9 years.  These three ages would be harmonized if there were a bit more Am-241 in the mix, specifically about 18% more, suggesting that some may have been removed in the earlier history of the sample.  The removal may have coincided with initial fuel processing delayed appreciably after fuel discharge from the reactor, or it may have been undertaken some time after the initial processing.  I am in favor of a view that americium was last chemically separated about four years after fuel discharge, the fuel itself being about 49 years out of the reactor (discharged in 1968), and that the separatory chemistry in the early 1970s was selective for Am and largely left ingrown Np-237 (parent of Pa-233) with the Pu.  This hypothesis harmonizes all three age estimates.

Original plutonium composition

Armed with an age estimate and current activity ratios among all the Pu isotopes, the calculation of mass composition at the time of preparation is straightforward using tabulated values of the half lives (or decay constants) of the isotopes.  Once again, there are assumptions in this calculation and in the conclusions derived from it.  The most important is probably that the plutonium was “fresh” when it was processed (or, more specifically, that the time difference between when irradiation stopped and when processing occurred was small enough to be insignificant to the isotopics).  Is that a good assumption?  Because the half-life of Pu-241 is only 14 years, and because the logistics of nuclear fuel processing usually dictate several years of cool-down during which time the fuel is in storage, transit from the reactor, and standing in queue for processing, this number is perhaps most suspect–and we would expect its calculated value and that of the correlated Pu-242 estimate to err on the low side.  Keeping this caveat in mind, here is the composition of the original KI-1 smoke detector plutonium as calculated from the Am-241:Pu-241 age:

What if the plutonium is actually four years older (1968) and was just processed in 1972, as the Pa-233 dating methods hint?  Then, the composition looks like the table below.  I believe this is more accurate:

Conclusions: Low-burnup, reactor-grade plutonium from 1970 is nothing to fear

With original Pu-240 concentration near 20%, the ~1 mg of plutonium used in this Soviet KI-1 smoke detector falls into the “reactor grade” classification rather than “weapon grade.”  The classification convention distinguishes plutonium compositions on the basis of Pu-240 content because of this isotope’s high spontaneous-fission neutron yield and its consequences for pre-initiation in nuclear weapons.  However, weapons made from reactor-grade plutonium are known to work.  Their yield may not be statistically reliable or as high as could be expected with weapon-grade fissile material, but they are useful weapons nonetheless.  The real barrier to would-be proliferants hoarding Soviet smoke detectors is the sheer number–millions!–of the motherfuckers they would in principle need to acquire through the typical nuclear smurfing networks.  (The entire output of the Soviet smoke detector industry is unlikely to have involved more than one formula quantity of plutonium.)

Now that we can sleep easily on the nuclear holocaust issue, I’ll add a few more observations about this plutonium.  Although reactor grade, its high fraction of Pu-239 and low fractions of Pu-241 and Pu-238 suggest moderately low burnup, probably not in excess of 5 GWd/t, in a reactor amenable to such light utilization (e.g. an isotope production reactor or online-refuelable type).  The measured dates of production (1968) and last separation (1972) rule out VVER and RBMK power reactors as sources.  Some of the RBMK’s graphite-moderated, low-enrichment-fueled predecessors designed for isotope production and co-located with processing plants (such as the ADE types) are likely origins.  These reactors also turned out a weapon-grade stream as the USSR frantically raced for nuclear parity with the Yankee imperialists.

thatsallfolks

h1

Herb Anderson’s “Live Block” of the Chicago Pile

June 4, 2016


They don’t give out spent nuclear fuel as a memento anymore.  But on the tenth anniversary of the first nuclear reactor (the Chicago Pile) going critical, pile physicist Herbert L. Anderson was presented with this handsome “live block” of graphite and uranium metal fuel, piping hot and right out of the reactor core.  With an estimated two millicuries of Cs-137 then distinguishing it from the natural uranium whence it was made, the unique artifact spent the next sixty years as part of Anderson’s home decor, a reminder of his pivotal role in one of the 20th century’s greatest triumphs in physics.  Herb’s wife Betsy kindly gave it to me in 2014 with the hope that new understanding and appreciation would follow.

Now, having had nearly two years to get to know this artifact, I can share some preliminary findings about it–and a few lingering questions as well.  I am grateful for ongoing partnerships with the University of Missouri and the Vinca Institute of Nuclear Sciences that are bringing new details to light about its metallurgy and history, and I am grateful for past assistance from the University of New Mexico here in Albuquerque.  I am actively searching for ways to bring this piece of the first reactor to an appreciative public audience.  So, dear reader, if you have suggestions or information that will help with either the technical understanding of the artifact, or its accommodation in a museum for the upcoming 75th anniversary of the Manhattan Project, please get in touch.

Part I: Basic physical description

DSCF3005_v1

This is a “live block” (meaning a piece of graphite with nuclear fuel installed in it), distinguished from the “dead blocks” of pure graphite that were interspersed or used as reflectors in the Chicago Pile.  Several museums possess “dead blocks”; to my knowledge, these include the American Museum of Science and Energy (Oak Ridge), the Bradbury Science Museum (Los Alamos), the National Atomic Testing Museum (Las Vegas), and the National Museum of Nuclear Science and History (Albuquerque).  My friend Kelly Michaels has an excellent photo set of these artifacts.  Pieces of Chicago Pile fuel also survive independently;  most notably, this piece once belonging to Alvin Weinberg.  However, the Herb Anderson “live block” is unique, to my knowledge, in that it contains fuel and moderator together.  The block’s measured dimensions, including fuel dimensions and those of the decorative housing, are available in a SolidWorks model to interested parties (please contact me).

The “T01” lot stamp appearing on the right face of the graphite block indicates that the graphite is AGOT made by the National Carbon Company, one of at least six types of graphite used to build the Pile.  AGOT had the lowest neutron absorption of all of these types, so was preferred for the pile’s core region.  About 2/3 of the CP-1 pile consisted of AGOT.  This grade of nuclear graphite went on to be used in the Graphite Reactor at Oak Ridge and the plutonium production reactors at Hanford.

The fuel is unclad uranium metal in cylindrical elements that bear identifying stamp marks on the front faces.  When I replaced the original cracked acrylic housing around the artifact, I was able to weigh the fuel elements directly.  The left element weighed 2.564 kg, and the right one, 2.553 kg.  The left element stamp reads “M230/L101/P2” while the right one reads “M170/L79/P1”.  The significance of these marks remains unknown to me.  I believe that if someone is able to assist in their interpretation, we might learn which of the three recorded contributing manufacturers of U metal produced this fuel.  It should be noted that metal fuel was a small minority of the Chicago Pile fuel, amounting to just 5.4 metric tons; the vast majority of the fuel was pressed-oxide “pseudosphere” elements.  Metal was made variously by Westinghouse, Metal Hydrides Corp., or the Ames Process.

Another question raised by this artifact is that it contains cylindrical metal fuel placed into chamfered recesses in the graphite designed for receiving “pseudosphere” oxide fuel.  As such, the cylinders cannot remain centered or upright in the recesses without the assistance of some acrylic supports that may be seen in the x-ray image.  I am quite sure that acrylic was not part of the original pile construction!  One is tempted to question, then, whether this fuel-and-stringer combination is original.  It could be that most graphite live blocks were machined for pseudosphere fuel, but when metal became available, the pseudosphere live blocks were used anyway (perhaps with graphite inserts serving the mechanical function of the acrylic supports, which begs the question of why the artifact contains acrylic instead; or perhaps without any supports, the fuel cylinders simply being dropped awkwardly into the recesses).  A lack of detailed photos from the construction of CP-1 makes the question hard to answer.

Part II: Gamma spectrometric estimate of fuel burnup

gammaspec_150704

Mentioned earlier is the fact that this fuel contains cesium-137.  In fact, the external radiation signatures are dominated by this long-lived fission product.  Without a doubt, then, the fuel has been significantly exposed to reactor operation.  By comparing count rates in the Pa-234m gamma peaks to that in the Cs-137 peak at 662 keV, we can determine the quantity of Cs-137 remaining in the fuel under the assumption that the Pa-234m is in equilibrium with its U-238 parent.  This will motivate the estimation of fuel burnup range under various assumptions about the artifact’s history.  I performed the requisite experiments with my PGT germanium detector and obtained the spectrum shown above, leading to an estimated activity of 540 microcuries of Cs-137 distributed throughout the total fuel at the time of measurement.  Here are a few historical scenarios and the fuel burnup roughly corresponding to them:

  • The fuel operates in CP-1 only (December 1942-February 1943):  163 kWd/MTU
  • The fuel operates in CP-1 and its reconstruction in the Red Gate Woods (CP-2), and is removed from the operating reactor before being presented to Herb Anderson in November 1952 at the Tenth Anniversary celebration in Chicago: 132 kWd/MTU
  • The fuel was removed from the pile (CP-2) when it was decommissioned in 1954, and somehow was then integrated into the artifact: 127 kWd/MTU

There are challenges with all three potential histories.  The first is very unrealistic, given the known operating conditions of CP-1 in the brief months it was in use.  Intermittently critical, with a peak power of ~200 W achieved on one day only, the burnup in the fuel attested by these calculations is many thousands of times greater than what is possible according to the conventional history of that Pile.  The second scenario is supported by both the burnup calculation (even though I am aware of no formal operating records from CP-2) and the description given by Mrs. Anderson of how Herb got the item, but it leads to two big puzzles, firstly concerning how the fuel was removed from the reactor while the reactor was still in service, as the pile was not designed to be easily disassembled in the CP-2 instantiation; and secondly concerning the high activity levels of the discharged fuel when it must have been released from government custody to Anderson.  The third explanation avoids the issue of taking apart the reactor just to obtain a souvenir as the reactor was disassembled during decommissioning; however, it is historically inconsistent with the story told by Mrs. Anderson.  So what this gamma spectrometry measurement allows us to say with certainty is that the fuel was used in CP-2 (as well as the original pile, presumably).  Beyond that, plenty of thought-provoking questions remain.

Part III: Neutron multiplication properties

It would seem there is no greater aspiration for a piece of the world’s first nuclear reactor than to return, momentarily, to the task originally undertaken with so much fanfare: multiplying neutrons in fission chain reactions.  These three photos above show some multichannel-scaling apparatus to look at fission in the CP-1 block (set up in my kitchen, because this is a “cooking” project of sorts).  We are going to examine the time correlation between neutron counts in a bank of two He-3 proportional counters next to our specimen.  Both counter tubes and the specimen are reflected by polyethylene blocks to trap neutrons in the system as best we can.  Highly-correlated counts point to fission “chains”, in which a fission event causatively leads to successive ones on a time scale controlled by the neutron transport properties of the specimen and surroundings.  I’ll measure correlation by way of excess variance, or the Feynman Y-statistic: the difference between the measured variance-to-mean ratio of counts accumulated in a certain time window interval and unity (which corresponds to idealized, uncorrelated, Poisson-distributed counts).  We’ll look at the CP-1 live block by itself and with a small additional neutron source present.  We will also look at the neutron source alone, a lead brick, and the empty polyethylene cavity.  Results and commentary below.

So what the fuck does this mean?  Firstly, the CP-1 block by itself produces strongly time-correlated neutrons (purple data) on a measurement scale of about a millisecond or greater, while the little homemade AmBe neutron source is pretty much stochastic (red data).  (Note, though, that the AmBe source is about five times stronger a neutron source than the block.)  Putting the block in with the AmBe source slightly reduces the neutron count (~12%) versus the source alone, but produces excess correlation of nearly 30% of the block by itself, indicating the presence of induced fission.  The high correlation in the block itself may be attributed to spontaneous fission (SF) as a minor decay mode of U-238, as well as a smaller contribution of spallation and fission induced by secondary cosmic rays.  These neutron sources each produce a burst of neutrons, and are also closely coupled to successive induced fissions.  The AmBe source, by contrast, is driven by radioactive decay: alpha particles slam into beryllium.  Notice the curvature of the data in all cases: it rises as we lengthen the counting window.  That is to say, there is more neutron correlation as the window gets longer.  Neutrons take their time moving through materials, scattering, slowing down, and finally reaching the detector, and neutrons produced in coincidence will not register as such unless the window is long enough to account for their random meanderings through material.  Finally, just to illustrate fission and other fission-like reactions in something other than uranium, I put a 20-pound lead brick in the counter.  Now you may believe that lead is not a fissionable material, but under the right conditions–such as when a 500-MeV electron in the secondary cosmic ray spectrum hits it–the lead nucleus can split up by fission or by a somewhat similar process called spallation, cooking off a distribution of neutrons.  And that is why we see highly-correlated neutrons (green data) being emitted by lead.  Again note the upper right graph, though: lead is a very weak source of neutrons even though the ones that are emitted are highly time-correlated.

h1

Gamma Analysis of Chagan “Atomsite”

August 19, 2012

Lake Chagan (“Atomic Lake”) was formed in 1965 following a thermonuclear cratering explosion on the Semipalatinsk Test Site in Kazakhstan.  More photos from my recent trip to the site are here.  Merely visiting the site does not answer some of the most interesting questions about its current state, such as the isotopic origin of the significant (1-2 mR/hr) gamma radiation.

I decided to take a more scientific look at the gamma rays emitted from Chagan’s fused rock—the glassy, vesiculated slag (“atomsite” or “kharitonchiki”) that covers the ground near the shore of the lake.  A grab sample was acquired, and transported home by means other than my own return flight from Almaty (this airport’s departure lounge is guarded by a notoriously-sensitive portal scintillator made by Aspect).  I filled a 3-ounce plastic jar with the material for counting.

My method of analyzing this unique “soil sample” is HPGe gamma-ray spectrometry.  I followed the same approach discussed in my earlier analysis of Japanese soils, involving comparison of the test specimen with an identically-shaped Cs-137 sand standard.  My germanium detector is operated via a homebrew LabVIEW program built around Mark Rivers’ EPICS interface for the Canberra 556 AIM MCA and Carsten Winkler’s CA Lab; I subsequently analyze the spectra (peak fitting, background subtraction, energy calibration) with FitzPeaks.  In this experiment I collected an 8000-second count of the slag sample and a 2000-second count of the Cs-137 sand standard.  An appropriate long-duration background was subtracted from each.  The quantitative calculation of activities relies on a single major line from each nuclide, chosen (to the extent possible) to be close to 662 keV.  Corrections for detector energy response were made by calibrating the energy-dependent photopeak efficiency in FitzPeaks to a point Ra-226 source, covering the range of roughly 200-1600 keV with a power-law model.  Corrections for material attenuation, including density variations from the standard, are NOT made from a calibration but are calculated based on an exponential attenuation model that assumes the sample has the elemental composition of concrete.  It’s probably not a bad comparison, and typically results in a correction of under 20%.  However, I expect better accuracy in the quantitative analysis for peaks that are closer to 662 keV.  Finally, no corrections are made for count losses to coincidence summing.  An Excel spreadsheet of this data and analysis may be downloaded here.

Referring to the 0-1600 keV gamma spectrum below, the first major observation is that most of the lines belong to europium isotopes, Eu-154 and Eu-152.  These isotopes were produced when neutrons from the “device” were captured by the ~1ppm naturally-abundant Eu-153 and Eu-151, respectively, which have remarkably high capture cross-sections.  These activation products are also long-lived enough to persist in significant quantity to the present day.  The other major long-lived gamma-emitting activation nuclide is Co-60.  Some of this cobalt could be from metal in the bomb’s well casing, but it could also be from activation of crustal mineralization.  The remaining major activity, Cs-137, is a product of fission in the bomb’s fissionable components.

Gamma spectrum of Lake Chagan atomsite

If we examine the smaller peaks in detail (click on below thumbnails), long-lived isotopes of holmium (Ho-166m), silver (Ag-108m), and barium (Ba-133) are in evidence.  Am-241 is present at a low concentration; on the basis of its 59-keV gamma line I cannot confidently estimate its concentration using the Cs-137 reference source technique.  Am-241 is the daughter of Pu-241 produced by neutron capture on plutonium in the bomb, and thus is a reliable proxy for the presence of plutonium in the sample.  The gamma radiations from plutonium itself are too weak and swamped by the spectrum’s low-energy continuum to be observed.

The chart below presents the results of the quantitative analysis.  Gamma-emitting radionuclide activity in “Chaganite” exceeds 375 Bq / g, with Eu-152 being the most concentrated.

Nuclide concentrations, July 30 2012

Chaganite versus Trinitite: when the activities are normalized to their initial values at the time of the respective explosions (1965 and 1945), a direct comparison can be made that illustrates just how much more radioactive the Chagan slag is (see beow).  The data for Trinitite is taken from Pittauerova, Kolb, et al., “Radioactivity in Trinitite: a review and new measurements,” Proc. 3rd Eur. IRPA Conference, Helsinki, 14-16 June 2010.

Comparison of “Chaganite” with Trinitite

The Chagan slag contained almost an order of magnitude more Cs-137 at the time of formation, but it is the rather staggering ratios of the activation nuclides that surprises me the most: 400 times as much Eu-154 in Chaganite versus Trinitite.  70 times as much Eu-152.  And 370 times as much Co-60.  Why?  One fairly obvious explanation is found in the facts that Chagan was a more powerful bomb, detonated in closer proximity to the crustal rock that its neutrons activated since it was underground.  Some further considerations may also be relevant.  According to Carey Sublette’s Nuclear Weapons Archive, Chagan “was reported to be a low-fission design, which had a pure thermonuclear secondary driven by a fission primary with a yield of about 5-7 kt.”  In contrast, the Trinity bomb was a pure fission core surrounded by a uranium tamper.  Thus, escaping neutrons with a hard DT fusion spectrum probably carried a significantly higher fraction of Chagan’s energy yield relative to Trinity’s.

There is not a statistically-different concentration of Ba-133 between the two slags.  I think most of Trinity’s Ba-133 came from the bomb’s explosives, while Chagan’s probably came from crustal concentrations of barium.

Finally, if the Trinity bomb had a fission yield more than three times larger than Chagan, why is the latter’s concentration of Cs-137 higher?  The best reason I can suggest is Chagan’s better underground containment of volatile fission products.  In a surface explosion, volatile Cs and its beta-decaying precursors exist as gases for a long time, enabling atmospheric dispersal.  In an underground explosion, volatiles are condensed rapidly near where they were formed.

h1

A Little Bit of Fission

June 3, 2012

One of the fun things you can do with uranium is to turn big atoms into little atoms.  All natural heavy nuclei will undergo fission after a hard enough kick (for instance, protons accelerated to around 50 MeV will fission gold or bismuth), but to split uranium, all you need are some household-variety neutrons.  Offering a neutron to a U-235 or U-238 nucleus is like giving Mr. Creosote his “wafer-thin mint” in the infamous Monty Python sketch: the recipient is violently blown to chunks and the surroundings drenched in postprandial gibbage!  Maybe I’ve gone overboard with that metaphor.  Anyhow, uranium fission residues include a long list of mostly-radioactive lighter nuclei, additional prompt and delayed neutrons, and some gamma rays.

25 grams of uranyl peroxide in a Nalgene bottle, ready to be irradiated with neutrons.

The 2-4 Ci PuBe source used to irradiate the uranium sample.  A string is provided for safe handling.

The experiment described here relates to the question of what specific fission product gamma signatures a nuclear hobbyist, equipped with typically limited resources, is likely to observe pursuant to neutron irradiation of some natural uranium.  Preliminary considerations suggest we’ll only notice products that emit strong gamma radiation, have a half-life comparable to or shorter than the irradiation period, and have high fission yields.  Uranium’s natural radioactivity causes additional complication, probably blinding us to fission products that emit at energies near the major features of the Pa-234 spectrum.  Beyond these generalities, predicting what we might see is a nontrivial task, so the question can really only be addressed convincingly by experiment.

Neutron source and uranium are lowered into a wax moderator.

_ at the University of _ kindly offered his HPGe detector for use in this experiment.

I irradiated 25 grams of natural uranyl peroxide, freshly prepared from Utah pitchblende ore, overnight with a ~5E+06 n/s PuBe neutron source.  This source intensity is comparable to contemporary hobby fusion neutron sources, like well-constructed Farnsworth fusors.  After irradiation, a 2.5-hour gamma spectrum of the sample was collected with an HPGe detector.  25g of non-irradiated uranyl peroxide in an identical container served as a control, the spectrum of the control being subtracted from the spectrum of the irradiated sample to eliminate most features belonging to uranium or its own decay daughters.  What we’re left with is a difference spectrum containing features attributable to the nuclear transmutations in the irradiated sample.  Here’s that gamma spectrum, in three graphs, encompassing the range of 200-1500 keV.  I have labelled the identified peaks.

So what did we make?  Here’s a summary of the nuclides contributing peaks found in the gamma spectrum, with my comments on a few.  All are short-lived, having half-lives between 30 minutes and 2.4 days.

  • Np-239: The largest new peaks in the above spectra are the ones at 229 and 278 keV belonging to Np-239, which is formed not by fission but by (n,g) neutron capture on U-238 followed by beta decay of U-239.  Np-239 is the parent of the important fissile isotope, Pu-239.
  • Sr-92: Although not the largest new activity, Sr-92’s peak at 1384 keV is the most prominent above background.
  • I-135 and Xe-135: These are high-yield fission products, Xe-135 being the daughter of I-135, having huge neutron cross-sections, responsible for effects known variously as “xenon poisoning” and the “iodine well” in nuclear reactor behavior.
  • Sr-91 and Y-91m: Sr-91 is a high-yield fission product; Y-91m is not, but grows in as Sr-91 decays.
  • Zr-97, Nb-97, and Nb-97m
  • I-133
  • I-134
  • Cs-138
  • La-142

If you’re doing a fission experiment with a very weak source of neutrons, and your irradiation time is on the order of at least a few hours, I recommend you first set your sights on Sr-92’s whopping peak out at 1384 keV.  If you can’t see that one, you probably won’t see anything else.  Xe-135 and the iodine isotopes might be easy to separate from an aqueous uranium solution by solvent extraction with corn oil or some similar nonpolar medium, improving their visibility against background.

More writeup on this experiment here.

Many thanks to _ at the University of _ for the use of some of his resources.

h1

Gamma activity measurements of Tokyo-area soil samples

November 4, 2011

Three nuclear reactors melted down at the Fukushima-I Nuclear Power Plant following the Tohoku Earthquake of March 11 this year, resulting in the release of volatile fission products in what is widely regarded as the worst nuclear accident since Chernobyl.  Radionuclides were carried by air currents across eastern Japan.  Areas closer to the stricken plant suffered heavier contamination, but even densely-populated Tokyo, some 150 miles distant, received significant fallout.  Last month, I received a set of six soil samples from the Tokyo region, and, using my HPGe gamma detector, I have attempted a quantitative analysis of the two predominant gamma activities in these samples, Cs-137 and Cs-134.  I am grateful to Jamie Morris for the specimens, and to Dr. Steven Myers, Los Alamos National Laboratory, for his helpful communications about technique and analysis.

Jamie collected six soil samples of about 5 fl. ounces apiece, three from roadside gutters and three from nearby garden areas in the greater Tokyo region, and sent them to me in Ziploc baggies by regular airmail declared as “soil samples.”  He documented his collecting spots with geotagged photos (below).

Upon receipt of Jamie’s samples, I packed them into 3-oz clear plastic wide-mouth jars (Uline S-17034), weighed the contents, and Superglued the lids on to prevent spills.

It is important to control the source-detector geometry in quantitative measurements.  To that end, I lathe-turned a holder for the jars out of acrylic that fits onto the HPGe detector’s cap.  The jars press-fit into this holder until the lip of the cap thread contacts the front face of the acrylic piece.  Held thusly, the bottom of the sample jar is nominally one inch from the end of the HPGe cap.

A standard source, consisting of a known quantity of Cs-137 in a matrix and geometry approximating those of the samples as closely as possible, will be used as a reference against which to compare the activity in the samples.  Although commercially available, such sources are astronomically expensive and companies making them are reluctant to sell to individuals who just want to fool around.  So I’ll produce my own from the following supplies, using the procedure recommended on Slide 23 of this IAEA presentation:

  • Play sand (Lowe’s)
  • Liquid Cs-137 source (25µl / 0.5 µCi nominal activity, ±5%) ordered from Spectrum Techniques
  • Sealed Cs-137 disk source (0.5 µCi nominal activity, ±5%) ordered from Spectrum Techniques
  • Nitric acid
  • Beakers, syringe, stirring rod
  • Geiger counter (or scintillator)
  • An oven

Basically, the Cs-137 is mixed with sand and put in a Uline jar.  Click any photo below for a caption describing relevant details from the process.

Gamma spectra are collected from each sample and from the standard in my Canberra NIM MCA, using Mark Rivers’ open-source “mca” application for EPICS and my own LabVIEW interface.  8192 channels of memory are used, with the gain set at about 0.2 keV per channel.  I process the spectra to subtract background and find peak areas in the free evaluation version of FitzPeaks (note: does not work on 64-bit Windows 7).  Spectra for each sample are displayed below (click any image for a full-size version).

Activities are estimated by comparing net counts in the relevant peaks in the sample spectra with net counts in the 662-keV peak of the standard source.  Count rates are scaled to account for gamma emission probability of each nuclide.  A simple exponential attenuation mode is used to correct for matrix density variations; better accuracy can be expected for samples that most closely resemble the standard (i.e. the gutter debris samples).  I use only the 605-keV peak to estimate Cs-134 activity, since it lies closer to the 662-keV calibration energy and the systematic errors involved with energy and matrix density corrections will be smaller than for the 796-keV peak.  Ultimately, the values of interest—specific activities, becquerel per kilogram—are obtained, along with uncertainty propagated through the calculations.  These values are illustrated below:

Download the data and analysis spreadsheet (Excel 2010 format) here.

In conclusion: The synthetic fission products CS-137 and Cs-134 dominate the natural gamma radioactivity (K-40 and U / Th daughters) in all six samples.   Cs-137 is present at levels at least 1-2 orders of magnitude above levels expected from older atmospheric weapons tests and the Chernobyl accident in every one of these samples.  Total activity is roughly evenly divided between Cs-137 and the shorter-lived Cs-134 at this time; the Cs-134 will decay to irrelevance in the span of 5-10 years.  Together, high concentrations of Cs-137 and Cs-134 point to the recent Fukushima accident as the source of virtually all of this activity. The gutter debris sample from Chiba (#C) has the highest activity, and depending on how representative this sample is of the surrounding soil, MAY be indicative of significant enough cancer risk to human residents to encourage alternate patterns of occupancy or land use.  More information would be needed to quantify the severity of this kind of risk from external exposure and various routes of possible internal exposure.   Sample #C is also easily detected with small consumer-grade and homebrew Geiger and scintillation counters.   It should be noted that various physical / chemical mechanisms (e.g., runoff of soluble Cs into road gutters) tend to increase the activity of some of these particular samples relative to the surroundings.